Water Quality Index and Regression Models for Predicting Water Quality and Water Quality Parameters for Tumkur Amanikere Lake Watershed, Tumkur, Karnataka, India
By Rajendra D. S. Prasad¹, C. Sadashivaiah², and G. Ranganna³
July 2009
- Research Scholar, Department of Civil Engineering, Siddagnaga Institute of Technology (SIT), Tumkur - 572 103, India
- Principal, Karavali Institute of Technology, Neeru Marga, Mangalore - 575 029, India
- Visiting Professor, UGC-CSA, Department of Mathematics, Central College Campus, Bangalore University, Bangalore - 560 00, India
Water quality indices aim at giving a single value to the water quality of a source on the basis of one or the other system which translates the list of constituents and their concentrations present in a sample into a single value. One can then compare different samples for quality on the basis of the index value of each sample. The present work relates to the development of water quality index for the study area Tumkur amanikere watershed based on the experimental results of physicochemical analysis of water samples of the watershed. The Water Quality Index (WQI) for the study area found to vary from 112.58 to 842.92. The high value of WQI at these sampling locations has been found to be mainly from the higher values of iron, nitrate, Total Dissolved Solids (TDS), hardness, fluorides, bicarbonates, magnesium and manganese in the groundwater. Regression models are also developed to quantify and predict water quality parameters based on the available TDS value.
Key words: Groundwater, Regression model, Water Quality Index (WQI), Water Quality standards, World Health Organization (WHO).
Introduction
The crucial role of water as the trigger and sustainer of civilizations has been witnessed throughout the human history. But, uptill as late as 1960s, the overriding interest in water has been vis a vis its quantity. Except in manifestly undesirable situations, the available water was automatically deemed utilizable water [8]. Only during the last three decades of the twentieth century the concern for water quality has been exceedingly felt so that, by now, water quality has acquired as much importance as water quantity [1].
According to WHO, about 80% of all the diseases in human beings are caused by water. Once the groundwater is contaminated, its quality cannot be restored by stopping the pollutants from the source. It is therefore imperative to regularly monitor the quality of groundwater and device ways and means to protect it. Water Quality Index (WQI) is one of the most effective tools to communicate information on the quality of water to concerned citizens and policy makers [3-7].
The formulation and use of indices has been strongly advocated by agencies responsible for water supply and control of water pollution. Once the water quality data has been collected through sampling and analysis, a need arises to translate it into a form that is easily understood. Once the WQI are developed and applied, they serve as convenient tools to examine trends, to highlight specific environmental conditions, and to help governmental decision-makers in evaluating the effectiveness of regulatory programmes [7-9].
The following four steps are most often associated with the development of any WQI; depending on the sophistication being aimed at, additional steps may also be taken [10-17]:
- Parameter selection
- Transformation of the parameters of different units and dimensions to a common scale
- Assignment of weightages to all the parameters
- Aggregation of sub-indices to produce a final index score
Salient features of the Study Area
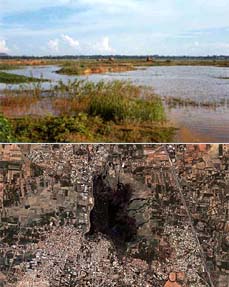
The proposed area under study i.e. Tumkur Amanikere lake watershed is located 0.5 km away from Tumkur Town on National Highway No.4. Tumkur town is 70 km away from the capital city Bangalore. Figure 1 shows the location map of Tumkur Amanikere lake watershed. The main occupation of Tumkur district population is agriculture and horticulture. It is also one of the major educations, small & medium sized industrial centers in Karnataka. Table 1 presents the snapshot of the Tumkur amanikere lake watershed. Groundwater in the study area occurs under water table conditions in the watershed and fractured granite and Gneisses.
| Latitude | N: 13° 21’ N | |
| Longitude | E: 77° 07’ E | |
| Altitude | Apx. 785 meters above sea level | |
| Area | 835 acres. | |
| Climate | Rainfall | Annual rainfall of 965 mm. |
| Humidity | The maximum humidity is in monsoons and early summer is the period of minimum humidity. | |
| Temperature | The maximum temperature is 38 °C, while the minimum is 11 °C. | |
| Capacity | 7.95MCUM | |
| Population | 2,48,000 (2001 census) | |
Figure 1 · Location of Tumkur Taluk and Tumkur Amanikere Lake Watershed
Methodology
Groundwater samples were collected from 22 locations from Tumkur amanikere lake watershed (Jan - February 2008). The collected water samples were transferred into precleaned polythene container for analysis of chemical characters. Chemical analyses were carried out for the major ion concentrations of the water samples collected from different locations using the standard procedures recommended by APHA-1994 [6]. The analytical data can be used for the classification of water for utilitarian purposes and for ascertaining various factors on which the chemical characteristics of water depend.
Figure 2 · Groundwater Sampling Locations
Water Quality Index (WQI) for Tumkur Amanikere Lake Watershed
Water quality affects the quality of drinking water and the capacity of the lake to support wildlife and healthy ecosystems. Water quality can be degraded by many different stressors in the watershed, including poor development practices and sprawl, poor stormwater management, destruction of wetlands, runoff from agricultural areas, and point source pollution. Water quality indices aim at giving a single value to the water quality of a source on the basis of one or the other system which translates the list of constituents and their concentrations present in a sample into a single value. One can then compare different samples for quality on the basis of the index value of each sample.
Brown et al. (1970) developed a water quality index similar in structure to Horton’s index but with much greater rigour in selecting parameters, developing a common scale, and assigning weights for which elaborate Delphic exercises were performed. This effort was supported by the National Sanitation Foundation (NSF). For this reason Brown’s index is also referred as NSFWQI.
Water quality indices have been used in India but not as extensively as the tool deserves. Except for the first reported Indian WQI (Bhargava 1985), other indices have been mostly weighted sum indices apparently inspired by Brown’s WQI.
For developing WQI for Tumkur amanikere lake watershed, the chemical analyses of 22 water samples analyzed during the year 2008 were considered. Each ground water was analysed for 16 parameters such as pH, EC, TDS, total hardness, bi-carbonate, chloride, sulphate, phosphate, nitrate, fluoride, calcium, magnesium, sodium, potassium, iron and manganese using standard procedures recommended by APHA [6]. However, we have chosen 12 important parameters as others having less or no bearing on the rest.
For computing WQI three steps are followed. In the first step, each of the 16 parameters has been assigned a weight (wi) according to its relative importance in the overall quality of water for drinking purposes as shown table 1. The maximum weight of 5 has been assigned to the parameter nitrate due to its importance in water quality assessment. Magnesisum which is given the minimum weight of 1 as magnesium by itself may not be harmful.
In the second step, the relative weight (Wi) is computed from the following equation:
Where, Wi is the relative weight, wi is the weight of each parameter and n is the number of parameters. Calculated relative weight (Wi) values of each parameter are presented in Table 2.
In the third step, a quality rating scale (qi) for each parameter is assigned by dividing its concentration in each water sample by its respective standard limit value according to the guidelines laid down in the Bureau of Indian Standards (BIS) and the result is multiplied by 100. The equation for qi is shown below:
qi = ( Ci / Si ) x 100
where qi is the quality rating, Ci is the concentration of each chemical parameter in each water sample in mg/l, and Si is the Indian drinking water standard limit for each chemical parameter in mg/l according to the BIS 10500:1991 (reaffirmed in September 2003).
For computing the WQI, the Sub-Index (SI) is first determined for each chemical parameter, which is then used to determine the WQI as per the following equations:
SIi = Wi . qi
WQI = S SIi
SIi is the subindex of ith parameter; qi is the rating based on concentration of ith parameter and n is the number of parameters. The computed WQI values are classified into five types, “excellent” to “ unsuitable for drinking”.
| Chemical Parameters | Indian Standards | Weight (Wi) | Relative Weight (Wi) |
| pH | 6.5 - 8.5 | 4 | 0.09756 |
| Total Hardness(TH) | 300 - 600 | 2 | 0.04878 |
| Calcium – Ca | 75 - 200 | 2 | 0.04878 |
| Magnesium – Mg | 30 - 100 | 2 | 0.04878 |
| Bicabonate – CaCO3 | 244 - 732 | 3 | 0.07317 |
| Chloride - Cl | 250 - 1000 | 3 | 0.07317 |
| Total Dissolved Solids(TDS) | 500 - 2000 | 4 | 0.09756 |
| Fluoride - F | 1 - 1.5 | 4 | 0.09756 |
| Manganese - Mn | 0.1 - 0.3 | 4 | 0.09756 |
| Nitrate – NO3 | 45 - 100 | 5 | 0.12195 |
| Iron - Fe | 0.3 - 1.0 | 4 | 0.09756 |
| Sulphate – SO4 | 200 - 400 | 4 | 0.09756 |
| Total | 41 | 1.00000 |
The computed WQI values ranges from 112.58 to 842.92 and therefore, can be categorized into five types “excellent” to “unsuitable for drinking”. Table 3 shows the percentage of water samples that falls under different quality. The high value of WQI at these sampling locations has been found to be mainly from the higher values of iron, nitrate, TDS, hardness, fluorides, bicarbonates, magnesium and manganese in the groundwater.
| WQI Value | Water Quality | Nº of Samples | Percentage of Water Samples |
| < 50 | Excellent | 0 | 0 |
| 50 – 100 | Good | 0 | 0 |
| 100 – 200 | Poor | 5 | 22.72727 |
| 200 – 300 | Very Poor | 5 | 22.72727 |
| > 300 | Unsuitable for Drinking | 12 | 54.54545 |
Regression Models for Predicting Water Quality Parameters
Regression models are used to predict one variable from one or more other variables. Regression models provide the scientist with a powerful tool, allowing predictions about past, present, or future events to be made with information about past or present events. The scientist employs these models either because it is less expensive in terms of time and/or money to collect the information to make the predictions than to collect the information about the event itself, or, more likely, because the event to be predicted will occur in some future time.
The chemical analyses of the groundwater and the percent compliance with the Indian standards [2] and WHO [3] are summarized in Table 4.
| Parameters | Indian Standard | Percent Compliance | WHO | Percent Compliance |
| pH | 6.5 – 8.5 | 77 | 7.0 – 8.0 | 36.36 |
| Electrical conductivity mmhos/cm | - | - | - | - |
| Total dissolved solids | 500 | 63.63 | 1000 | 100 |
| Total hardness as CaCO3, mg/L | 300 | 36.36 | 100 | 0 |
| Carbonate, mg/L | - | - | - | - |
| Bicarbonate, mg/L | - | - | - | - |
| Chloride, mg/L | 250 | 95.45 | 250 | 95.45 |
| Sulphate, mg/L | 200 | 100 | 250 | 100 |
| Phosphate, mg/L | - | - | - | - |
| Nitrate, mg/L | 45 | 72.72 | 50 | 77 |
| Fluoride, mg/L | 1 | 100 | 1 | 100 |
| Calcium, mg/L | 75 | 63.63 | 75 | 63.63 |
| Magnesium, mg/L | 30 | 0 | 30 | 0 |
| Sodium, mg/L | - | - | 200 | - |
| Potassium, mg/L | - | - | - | - |
| Iron, mg/L | 0.3 | 77 | 0.1 | 18.18 |
| Manganese, mg/L | 0.1 | 77 | 0.05 | 0 |
Normal statistics of water quality parameters of 22 samples are presented in Table 5.
| Parameters | Minimum | Maximum | Arithmetic Mean | Standard Deviation | Coefficient of Variation - CV | Median of the Lower Half | Median | Median of the Upper Half |
| pH | 6.27 | 8.9 | 6.9795455 | 0.6477321 | 0.0928043 | 7.05 | 6.815 | 6.8 |
| TH mg/l | 213 | 690 | 381 | 140.16963 | 0.3678993 | 295 | 340.5 | 6.8 |
| Ca++ mg/l | 14.03 | 98.6 | 31.445 | 20.154812 | 0.6409544 | 24.05 | 26.05 | 30.06 |
| Mg++ mg/l | 36.45 | 150.7 | 73.512273 | 29.690976 | 0.4038914 | 57.715 | 67.555 | 67.555 |
| HCO3- mg/l | 160 | 436 | 260.40909 | 67.025694 | 0.2573862 | 222 | 252 | 348 |
| Cl- mg/l | 62.38 | 255.9 | 125.415 | 58.247656 | 0.4644393 | 83.17 | 101.585 | 144 |
| EC mmhos/cm | 540 | 1540 | 880 | 315.59468 | 0.3586303 | 640 | 720 | 660 |
| TDS mg/l | 280 | 800 | 460 | 166.87606 | 0.362774 | 335 | 375 | 490 |
| F- mg/l | 0.09 | 0.92 | 0.5245455 | 0.2766763 | 0.5274592 | 0.47 | 0.62 | 0.62 |
| Mn mg/l | 0.11 | 0.83 | 0.3927273 | 0.2482353 | 0.6320807 | 0.225 | 0.37 | 0.43 |
| NO3- mg/l | 11.2 | 65.3 | 34.054545 | 18.787121 | 0.5516774 | 32.1 | 30.4 | 38.6 |
| Fe++ mg/l | 0.05 | 0.52 | 0.2154545 | 0.1309208 | 0.6076494 | 0.14 | 0.18 | 0.21 |
| SO4- mg/l | 0 | 57 | 25.090909 | 16.236083 | 0.6470903 | 14 | 22 | 25 |
| Na+ mg/l | 8 | 48 | 26.272727 | 13.547735 | 0.5156577 | 20 | 21 | 22 |
| K+ mg/l | 0.2 | 4 | 1.7272727 | 0.9803701 | 0.5675827 | 1.9 | 1.7 | 1.7 |
| PO4- mg/l | 0.05 | 5.8 | 1.2418182 | 1.668614 | 1.3436862 | 1.09 | 0.475 | 0.47 |
The following regression models have been obtained from the results of analysis water samples of Tumkur Amanikere lake watershed. Considering a known value of TDS, the percentage contribution of each ion can be obtained by substituting an average ionic value for the entire study area. The models were developed using MS Excel linear regression charts as shown in figures 2 and 3 below:
Figure 2 · Linear Regression for TDS vs CI
Figure 3 · Linear Regression for TDS vs EC
Table 6 shows the regression equations for parameters and coefficient of determination R² and Correlation coefficient (r).
| Parameters | Regression Equations | R² | Correlation r |
| Ca | 0.072 TDS - 1.679 | 0.3556 | 0.596211544 |
| Mg | 0.1407 TDS + 8.7836 | 0.6072 | 0.779230258 |
| HCO3 | 0.3357 TDS + 105.99 | 0.6985 | 0.835771911 |
| Cl | 0.3388 TDS - 30.416 | 0.9419 | 0.97053773 |
| Na | 0.031 TDS + 12.004 | 0.146 | 0.382082598 |
| TH | 0.7505 TDS + 32.067 | 0.8155 | 0.903075991 |
| EC | 1.8906 TDS + 10.342 | 0.9993 | 0.999666253 |
| TDS | 0.5286 EC - 5.1597 | 0.9993 | 0.999666253 |
The degree of a linear association between any two of the water quality parameters as measured by the simple correlation coefficient(r) is presented in the Table 7. Magnesium and chloride are highly interrelated with total hardness. Bicarbonate, chloride and total hardness are highly interrelated with TDS. This interrelationship indicates that the hardness of the water is permanent in nature.
| Parameters | pH | TH | Ca | Mg | HCO3 | Cl | TDS | F | Mn | NO3 | Fe |
| pH | 1.000 | ||||||||||
| TH | -0.303 | 1.000 | |||||||||
| Ca | -0.134 | 0.483 | 1.000 | ||||||||
| Mg | -0.288 | 0.935 | 0.140 | 1.000 | |||||||
| HCO3 | -0.116 | 0.875 | 0.489 | 0.792 | 1.000 | ||||||
| Cl | -0.135 | 0.885 | 0.685 | 0.722 | 0.787 | 1.000 | |||||
| TDS | -0.125 | 0.903 | 0.596 | 0.779 | 0.836 | 0.971 | 1.000 | ||||
| Fl | -0.125 | 0.220 | 0.260 | 0.143 | 0.042 | 0.353 | 0.389 | 1.000 | |||
| Mn | -0.215 | 0.731 | 0.197 | 0.747 | 0.628 | 0.590 | 0.593 | 0.073 | 1.000 | ||
| NO3 | -0.332 | 0.793 | 0.469 | 0.707 | 0.688 | 0.716 | 0.757 | 0.454 | 0.600 | 1.000 | |
| Fe | -0.238 | 0.187 | 0.049 | 0.191 | 0.247 | -0.028 | 0.082 | 0.302 | 0.140 | 0.324 | 1.000 |
| SO4 | -0.410 | 0.714 | 0.030 | 0.795 | 0.502 | 0.471 | 0.528 | 0.372 | 0.613 | 0.574 | 0.280 |
Conclusions
During the year 2008, based on the comparisons of chemical constituents with WHO (1994) standards, it is found that, for 22 samples, 14 samples have total hardness value above maximum permissible limit 300 mg/l.
Electrical conductivity of water is a direct function of its total dissolved salts. Hence it is an index to represent the total concentration of soluble salts in water. In this study area, the electrical conductivity of the groundwater samples varied between 540- 1540 mmhos/cm.
The permissible total dissolved salts for drinking water is 500 mg/l. In the absence of potable water source the permissible limit is upto 2000 mg/l. It is found from the analysis, all the well water samples TDS is within the maximum limit of 2000 mg/l. The range of TDS levels in the study area is 280-800 mg/l. 8 samples have TDS values beyond the desirable limit of 500 mg/l. The highest concentration of total dissolved solids was found to be 800mg/l for the sample No.8, due to dense residential area and due to intensive irrigation in that area. High values of TDS in groundwater are generally not harmful to human beings but high concentration of these may affect persons, who are suffering from kidney and heart diseases. Water containing high solids may cause laxative or constipation effects.
Chloride is widely distributed element in all types of rocks in one or the other form. Its affinity towards sodium is high. Therefore, its concentration is high in groundwaters, where the temperature is high and rainfall is less. Soil porosity and permeability also have a key role in building up the chlorides concentrations. The chloride content in the majority of samples (95.45%) of the study area was found to be well within the permissible levels. The chloride content ranges from 22.38 to 255.9 mg/l.
Magnesium exceeds in all the samples. It ranges from 36.45 to 150.7 mg/l. There are no known cases of magnesium poisoning. At large oral doses magnesium may cause vomiting and diarrhoea. High doses of magnesium in medicine and food supplements may cause muscle slackening, nerve problems, depressions and personality changes.
WQI for 22 samples ranges from 112.58 to 842.92. All the samples exceed 100, the upper limit for drinking water. The high value of WQI at these stations has been found to be mainly from higher values iron, nitrate, TDS, TH, fluoridres,, bicarbonates, magnesium and manganese in the groundwater. About 22.72% of water samples are poor in quality. In this part, the groundwater quality may improve due to inflow of freshwater of good quality during rainy season.
Magnesium and chloride are highly interrelated with total hardness. Bicarbonate, chloride and total hardness are highly interrelated with TDS. This interrelationship indicates that the hardness of the water is permanent in nature.
The analysis reveals that the groundwater of the area needs some degree of treatment before consumption and it also needs to be protected from the perils of contamination.
References
- S.A. Abbasi, Water quality Indices state-of-the art, center for pollution control and energy technology, Pondichery.
- BIS (Bureau of Indian Standards) 10500, Indian standard drinking water- specification, First revision, 1991(re-affirmed Sept 2003), pp 1-8.
- WHO (World Health Organization) Guidelines for drinking water quality, 2nd Ed. 1993, Vol 1, p 188.
- Misra P C and Patel R K, Indian J Envirnon Ecoplan, 2001, 5(2), 293-298
- Naik S and Puorhit K m, Indian J Environ Ecoplan, 2001, 5(2), 397-402
- APHA (American Public Health Association) Standard method for examination of water and wastewater, NW, DC, 20036, 1994
- Kumarswamy N, J Pollut Res., 1999, 10(1), 13-20
- Chanda D K, Hydrology J, 1999, 7(5), 431-439
- Ott, W.R., Environmental Indices, Theory and Practice, Ann Abbor. Science, Ann Arbor, Michigan., 1978.
- Ott, W.R., Water Quality Indices: A Survey of Indices used in the United States, U.S. Env. Production Agency, Washington, DC, EPA-600\4-78-005, 1978.
- Ott, W.R., Water Quality Indices: A Survey of Indices used in the United States, EPA – 600\4-78-005, Environmental Protection Agency, Washington, D.C., 1978
- Pielou, E.C., Mathematical Ecology, John Willey and Sons, Inc., New York, 1977
- Prati, L. et al., Assessment of Surface Water Quality by a Single Index of Pollution, Water Research, 5, 741-751, 1971
- Ramakrishaniah et. Al., Assessment of Water Quality Index for the
Groundwater in Tumkur Taluk, Karnataka State, India, E-Journal Chemistry, 2009, 6(2), 523-530 - Schaeffer, David J., and Konanur, G.J., Communicating Environmental Information to the Public: A Water Quality Index, J. Environ. Educ., 8(4), 16-26, 1977
- Harilal C C, Hashim A, Arun P R and Baji S, J Ecology, Environment and Conservation, 2004, 10(2), 187-192.
- Mohen Nasirian, A New Water Quality Index for Environmental Contamination, Journal of Apllied Scien, Vol – 7, 2007
- Rashmi Sisodia, Assement of the Water Quality Index of Wetland Kalahko lake, Rajashtan, India, Journal of Environmental Hydrology, JHE Vol -14, 2006
***
Copyright © 2009, ECO Services International