A Comparative Study of Solid Waste Generation at Mansa Devi and Chandi Devi Temples in the Shiwalik Foothills, during the Kumbh Mela 2010
By Sudhanshu Kaushik¹ and Prof. Dr. Bishambhar Datt Joshi²
April 2011
The Authors are a Research Scholar¹* and a Senior Professor² at the Department of Zoology & Environmental Sciences, Faculty of Life Science, Gurukula Kangri Vishwavidyalaya, in Haridwar, Uttarakhand, India. * Corresponding Author
The present study deals about solid waste generation over the Mansa Devi and Chandi Devi hillock at Haridwar during the Kumbh festival of 2010. Total amount of solid waste generated for seven days of collection was 7615.0 Kg and 4992.7 Kg at Mansa Devi and Chandi Devi temples, respectively. The composition of solid waste was about 64.7% biodegradable waste and 12.3% non biodegradable and 23.0% miscellaneous waste at Mansa Devi hillock. On the other hand Chandi Devi hillock had 62.1% biodegradable, 12.3% non biodegradable and 25.6% miscellaneous wastes, while during normal non festive days 62.7% biodegradable, 10.2% non biodegradable, 27.1% miscellaneous solid waste was found at Mansa Devi and 62.2% biodegradable, 13.4% non biodegradable and 24.4% miscellaneous was found at Chandi Devi hillock.
Keywords: Bio-degradable, Non-biodegradable, Kumbh, Festive and Non-festive days
Introduction
Solid wastes in and around cities and at sacred places like temples etc. are of mixed composition. The waste materials are produced by various activities of the society mainly the pilgrims. Mostly the solid waste material is the part which has lost its utility and value to the first user or consumer, and is now a growing problem at global, regional and local levels. Improper disposal of solid waste pollutes all the vital components of the living environment as air, land and water. The problem is more acute in developing nations than among the developed nations, mainly due to using latest technology and methods of waste management. As it necessitates management at generation, storage, collection, transfer and transport, processing and disposal stage sand sites, in an environmentally hygienic manner in accordance to the best principles of public health, economics, engineering, conservation, aesthetic and environmental considerations. Thus solid waste management includes all administrative, financial, legal, planning and engineering functions1.
In Indian cities solid waste generation rate is on the increase. The average per capita solid waste generation in India has increased from 0.32 kg/day in 1973 to 0.48 kg/day in 1994. Daily per capita generation of MSW in India ranges between about 100 g in small towns to 500 g in large towns2. In 1995, EPRIT, Hyderabad showed that 23 big Indian cities generated 11 million tones (mt) of solid waste every year. But now urban centers of India produce about 1, 20,000 t of solid waste each day; this is expected to reach 300 mt per annum by the end of 20472.
India famous for its festivities has far more occasions of solid waste generation than in other countries, during different religious festivals celebrated round the year. For example every year Kanwar Mela is celebrated during July-August, while Kumbh and Ardh Kumbhs are celebrated after 12 and 6 yrs intervals respectively, when the planet Sun, Moon and Jupiter are in a specific configuration. There are many legends about the Kumbh. Kumbh literally means an earthenware receptacle to store water or any such liquid item. In earlier time, the most popular Kumbh festival served as a gathering place for Vaidic scholars to debate on the religious laws and discourses, but ultimately it is the sanctity of the rivers like Ganga and the innate faith of Hindus which draws pilgrims to certain selected location like Haridwar, Prayag at Allahabad, Ujjain and Nasik to have a holy bath at a particular spot.
Materials and Methods
A survey was carried out during the Kumbh festival of 2010, to find out the impact of pilgrims on environmental aspects of Mansa Devi and Chandi Devi hillock. This paper deals with the solid waste generation, from the two most visited temples during a normal and six festive days. Solid wastes was physically collected and analyzed on a normal day and festive days like Makar Sankranti, Magh Purnima, Maha Shivratri, Chaitra Amavasya, Chaitra Purnima and Mesh Sankranti (Solar ingression in the Zodiacle signs of Capricorn, Aries and full or new moon days during the solar months of Capricorn, Aquaries, Pisces and Aries etc.). The solid waste was segregated in category of Organic Matter, paper, textile, plastic, glass and miscellaneous at both temple sites. A field assistant was hired to help the collection and segregation of solid waste. The number of pilgrims was assessed by the random head counting method during normal and festive days of Kumbh festival.
Results
In the present study it was found that the total amount of solid waste on Mansa Devi and Chandi Devi temple were 7615.0 Kg and 4992.1 Kg, respectively, during seven days of collection in the festival of Kumbh, 2010 in Haridwar city. The composition of this total amount of solid waste was 64.7% biodegradable waste and 12.3% non biodegradable and 23.0% miscellaneous waste at Mansa Devi hillock (Bilwa Parvat). On the other hand at Chandi Devi hillock (Neel Parvat) it was 62.1% biodegradable, 12.3% non biodegradable and 25.6% miscellaneous waste during festive days. While in the normal day 62.7% biodegradable, 10.2% non biodegradable, 27.1% of miscellaneous category was found at Mansa Devi and 62.2% biodegradable, 13.4% non biodegradable and 24.4% miscellaneous was found at Chandi Devi hillock.
| Nº | Occasions | Total solid waste | Organic Matter | Paper | textile | Plastic | Glass | Miscellaneous |
| Mansa Devi Temple | ||||||||
| 1. | Normal day (05 Jan.) | 215.4 | 111.8 | 8.6 | 14.8 | 9.1 | 12.7 | 58.4 |
| 2. | Makar Sankranti (14 Jan.) | 419.8 | 217.8 | 20.6 | 27.7 | 24.3 | 28.2 | 101.2 |
| 3. | Magh Purnima (30 Jan.) | 470.9 | 241.5 | 22.6 | 30.2 | 27.8 | 32.0 | 116.8 |
| 4. | Mahashivratri(12 Feb.) | 1170.0 | 609.6 | 56.8 | 76.7 | 65.5 | 74.8 | 286.6 |
| 5. | Chaitra Amavasya (15 March) | 1439.8 | 717.0 | 69.2 | 83.5 | 84.9 | 95.0 | 390.2 |
| 6. | Chaitra purnima (30 March) | 1418.6 | 719.2 | 69.5 | 112.0 | 96.5 | 100.7 | 320.6 |
| 7. | Mesh Sankranti (14 April) | 2480.5 | 1446.1 | 119.0 | 151.3 | 146.3 | 136.4 | 471.3 |
| A. | Total | 7615.0 | 4063.0 | 366.3 | 496.2 | 454.4 | 479.8 | 1745.1 |
| Chandi Devi Temple | ||||||||
| 1. | Normal day (04 Jan.) | 190.5 | 97.3 | 9.2 | 11.8 | 12.4 | 13.3 | 46.5 |
| 2. | Makar Sankranti (14 Jan.) | 279.6 | 150.2 | 12.6 | 19.3 | 17.8 | 20.4 | 59.3 |
| 3. | Magh Purnima (30 Jan.) | 374.5 | 194.8 | 18.6 | 23.6 | 21.2 | 26.4 | 89.9 |
| 4. | Mahashivratri (12 Feb.) | 780.0 | 388.4 | 37.4 | 46.0 | 48.4 | 52.3 | 207.5 |
| 5. | Chaitra Amavasya (15 March) | 845.9 | 430.5 | 33.9 | 49.9 | 42.5 | 59.5 | 229.6 |
| 6. | Chaitra purnima (30 March) | 1169.9 | 608.2 | 45.6 | 80.7 | 49.4 | 69.0 | 317.0 |
| 7. | Mesh Sankranti (14 April) | 1351.7 | 687.6 | 64.9 | 87.9 | 83.8 | 94.6 | 332.9 |
| B. | Total | 4992.7 | 2557.0 | 222.2 | 319.8 | 275.5 | 335.5 | 1282.7 |
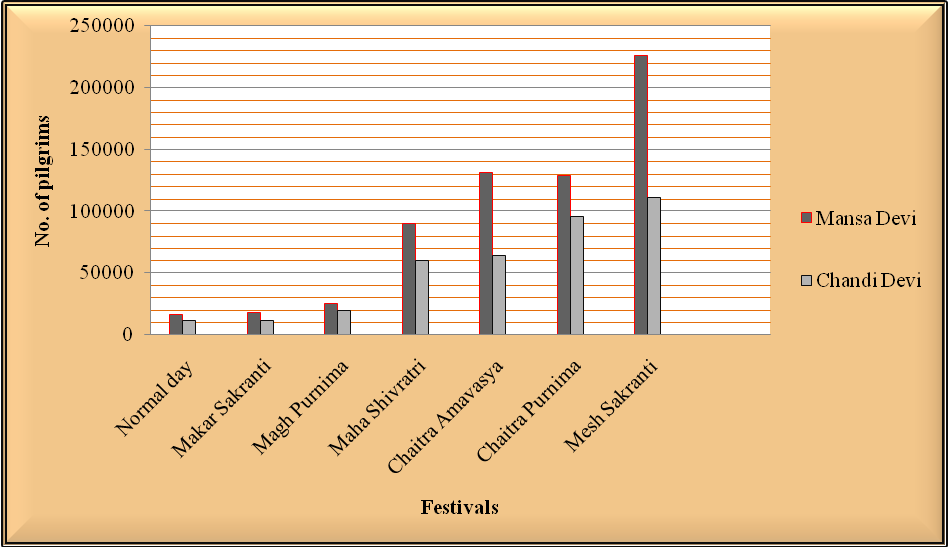
Figure 1 · No. of pilgrims reached to the temples during Kumbh festivals 2010
Discussion
Hardwar has been a revered centre for pilgrimage ever since time immemorial, when it was known as Mayapuri, as has also been mentioned by the Chinese traveler Huin Tsang in his memories. It is also said that Haridwar has been sanctified by the presence of three Gods (Trinity) of Hinduism, i.e. Lord Brahma, Vishnu and Mahesh. Devout believers feel that they can go to heaven by getting their salvation after a dip in the sacred Ganga at Haridwar3. During such occasions heavy influx of visitors changes the population structure of the city for many weeks. This in turn creates problems of shelter, food and transport, etc. and for satisfying their needs, many changes are taking place regularly in the natural, social, economic and cultural environment. As a result of this, Haridwar and its environs which were once covered with beautiful lush green forests, have now become changed to merely a cultural entity.
Mansa Devi and Chandi devi hillock are among the most sacred temples, visited by at least around 10,000-15000 persons on any ordinary normal day. The numbers of visitors to these two temples rises between 40,000 to 50,000 on any single festive day of the year. This number may rise up to 75,000 per day during specific festive days of the Kumbh year. The pilgrims visiting the temples during these normal and festive days causes a lot of problems in the concerned areas, because they carry different types of offering to the Deities like coconuts, specific dresses, sweets and millets etc. All these type of offerings are taken mostly in polythene bags and various types of bamboo baskets and after offering to the Deities these offerings and carry bags etc. are left at the temple sites, where these items are rarely collected for proper scientific disposal. A lot of left over material is generally swept to the valleys and often burned, when heaped in large amounts. Kaushik and Joshi(2010) studied the impact of pilgrimage on the various environmental components of Mansa Devi hillock and suggested some remedial measure to soil erosion/landslides in the concerned area4.
The composition of solid waste at Mansa Devi temple showed 53.4% OM, 4.9% paper, 6.5% textile, 5.9% plastics, 6.4% glass and 22.9% miscellaneous. While 51.2% OM, 4.5% paper, 6.4% textile, 5.5% plastics, 6.7% glass and 25.7% miscellaneous components were found at Chandi devi temple. Overall highest and lowest amount of solid wastes collected on any single day were 2480.5 Kg. and 279.6 Kg. at Mansa Devi and Chandi Devi hillock on Mesh Sankranti (solar ingression to Aries sign of Zodiac) and Makar Sankranti (solar ingression to Capricorn sign of Zodiac), which were 1051% and 46.8% higher, respectively than the amount of a normal non festive day. These temples offer the same activities to the pilgrims but the distance of the temples play a major role in the number of pilgrims visiting the two locations. The Mansa Devi temple is in the heart of the city, while the Chandi devi temple is about 5 km. far away from the Harki Pauri (main bathing site of Haridwar). Hence the numbers of pilgrims have a wide difference to both the temples.
Gangwar and Joshi (2008) studied the quantity of solid waste during the Ardh Kumbh period of 2004. They reported that 62.20% biodegradable, 17.14% Non Biodegradable and 13.61% miscellaneous during the different festivals of Ardh Kumbh5. Kaur and Joshi (2002) reported that Hardwar city proper generated 1873.7 Kg organic matter during any normal non festive day6. Sharma et, al. (2010) surveyed different type of colonies in Haridwar city and observed that the financially better-off localities generate roughly twice as much garbage as people from slum areas7. According to Mishra and Joshi (2002), 20,435 Kg solid waste was generated in Hardwar city during the important six festive occasions in 1997. These data give us a vivid status of solid waste generation for this holy city, during different occasions8.
However the improper fate of solid wastes and mismanagement of sanitary system create disease supportive environment after the period of festive occasions as reported by Saini et,al. (2009) in case of Kanwar festival in Haridwar City9. Dhere et. al. (2008) studied the adverse impact of municipal solid waste on air and ground water due to the improper disposal of waste in Pune city2. Waste material also impacts the soil quality as pointed out by Ahel et. al. (1998) mainly by increasing the concentration of various hazardous elements of soil through municipal solid waste10. In this series Omofonmwan and Esiegbe (2009) reported the ground water contamination due to the lechate contribution of the solid waste in metropolitan city of Nigeria11. Zalili and Noori (2008) also described the adverse impact of solid waste in concerned areas12.
Mondal et. al (2010) described the role of EIA to manage the solid waste problems13. Therefore it appears that EIA can play an important role to minimize and manage the solid waste during the different festival and normal days at the study site and separation of the waste as Biodegradable and non biodegradable at the point will be very helpful to manage the wastes material. According to Buenrostro et.al. (2001) classification of the municipal solid waste at the source will be very useful to manage the waste especially for the developing countries14.
Conclusion
Solid waste management has now acquired a permanent chronically ill status at the global level, but the places more affected are of historical, religious and touristic importance to the world. As for river Ganga at Haridwar, a lot of pilgrims visit to take a holy dip in the river and visit these sacred temples. But during the Kumbh and Ardh kumbh period the heavy influx of the pilgrims at Haridwar flowing to Mansa Devi, Chandi Devi, Bharat Mata Mandir and Daksha Mahadev temple etc. leads to the creation of huge amount of solid waste, besides impacting to various environmental problems like water, air, noise pollution and disease born out of these, beside many other social problems. Therefore it is an urgent need to make a strategy for the pilgrim’s related activities. An Environment Impact assessment should be made well before these types of festivals. A joint participation of Government and local people to be made mandatory to assess the social impact studies which will support for a long way to organize future events more aesthetically, hygienically, economically and in environment friendly manner.
References
- Ramachandra, T. V. and Bachamanda, S. (2007). Environmental audit of municipal solid waste management. Int. J. Env. Tech. Manage. 7(3/4): 369-391
- Dhere, M.A., Chandrasekhar, B. P., Pratapsingh, B. P. & Dhanraj, A. P. (2008). Municipal solid waste disposal in Pune city- An analysis of air and groundwater pollution. 95 (6): 773-777.
- Garg, S.P. & Porwal, M.C.(1986): Impact of tourism on Haridwar and its environs with special reference to Kumbh 1986. In Impact of tourism on mountain environment. Research India publication, Meerut, India pp 364-373.
- Kaushik, S. and Joshi, B. D. (2010). A note on the pilgrimage pressure on Mansa Devi hillock of Haridwar. J. Env. Bio-Sci. 24 (2): 267-269.
- Gangwar, K. K. and Joshi, B. D. (2008). A preliminary study on solid waste generation at Har Ki Pauri, Haridwar, around the Ardh-Kumbh period of sacred bathing in river Ganga in 2004.The Environmentalist 28: 297-300.
- Kaur, S. & Joshi, N., (2002). The solid waste generation during normal days in Haridwar city. Him J. Env .Zool. 16(2): 267-270.
- Sharma, V., Saini, P. & Joshi, B. D. (2010). Assessment of municipal solid waste generation and its management in the holy city of Haridwar, Uttarakhand State, India. Wast. Manage. 30: 725-728.
- Mishra, S. & Joshi, N. (2002). Generation of solid waste during festive occasions in Hardwar city. Him. J. Env. Zool. 16(2): 263-266.
- Saini, P., Sharma, V. and Joshi, B. D. (2009). A random survey report about rise in water borne disease. J. Env. Bio-Sci. 23 (2): 215-219
- Ahel, M., Mikac, N. Cosvic, B. Prohic, E. and Soukup, V. (1998). The impact of contamination from a municipal solid waste landfill (Zagreb, Croatia) on underlying soil. Wat. Sci. Tech. 37 (8): 203-210.
- Omofonmwan, S. I. & Eseigbe, J. O. (2009). Effect of solid waste on the quality of underground water in Benin Metropolis, Nigeria. J. Hum. Ecol. 26(2): 99-105.
- Zade, J. G. M. & Noori, R. (2008). Prediction of solid waste generation by use of artificial neural neatwork: A case study of Mashhad. Int. J. Environ. Res. 2(1): 13-22.
- Mondal, M. K., Rashmi, & Dasgupta, B. V. (2010). EIA of Municipal solid waste disposal site in Varansi using RIAM analysis. Resor. Cons. Recyc. 54(9): 541-546
- Buenrostro, O. Bocco, G. & Cram, S. (2001). Classification of sources of municipal solid wastes in developing countries. Resor. Cons. Recyc. 32: 29-41.
***
Copyright © 2011, ECO Services International